Article 10 of our Digital Transformation Journey. We've covered strategy, execution, and recognizing breakthrough. Today: What the complete journey actually looks like.
In the last nine articles, we've explored digital chaos warning signs, calculated staggering costs, learned frameworks, made technology decisions, avoided fatal mistakes, managed patience, and recognized breakthrough signals.
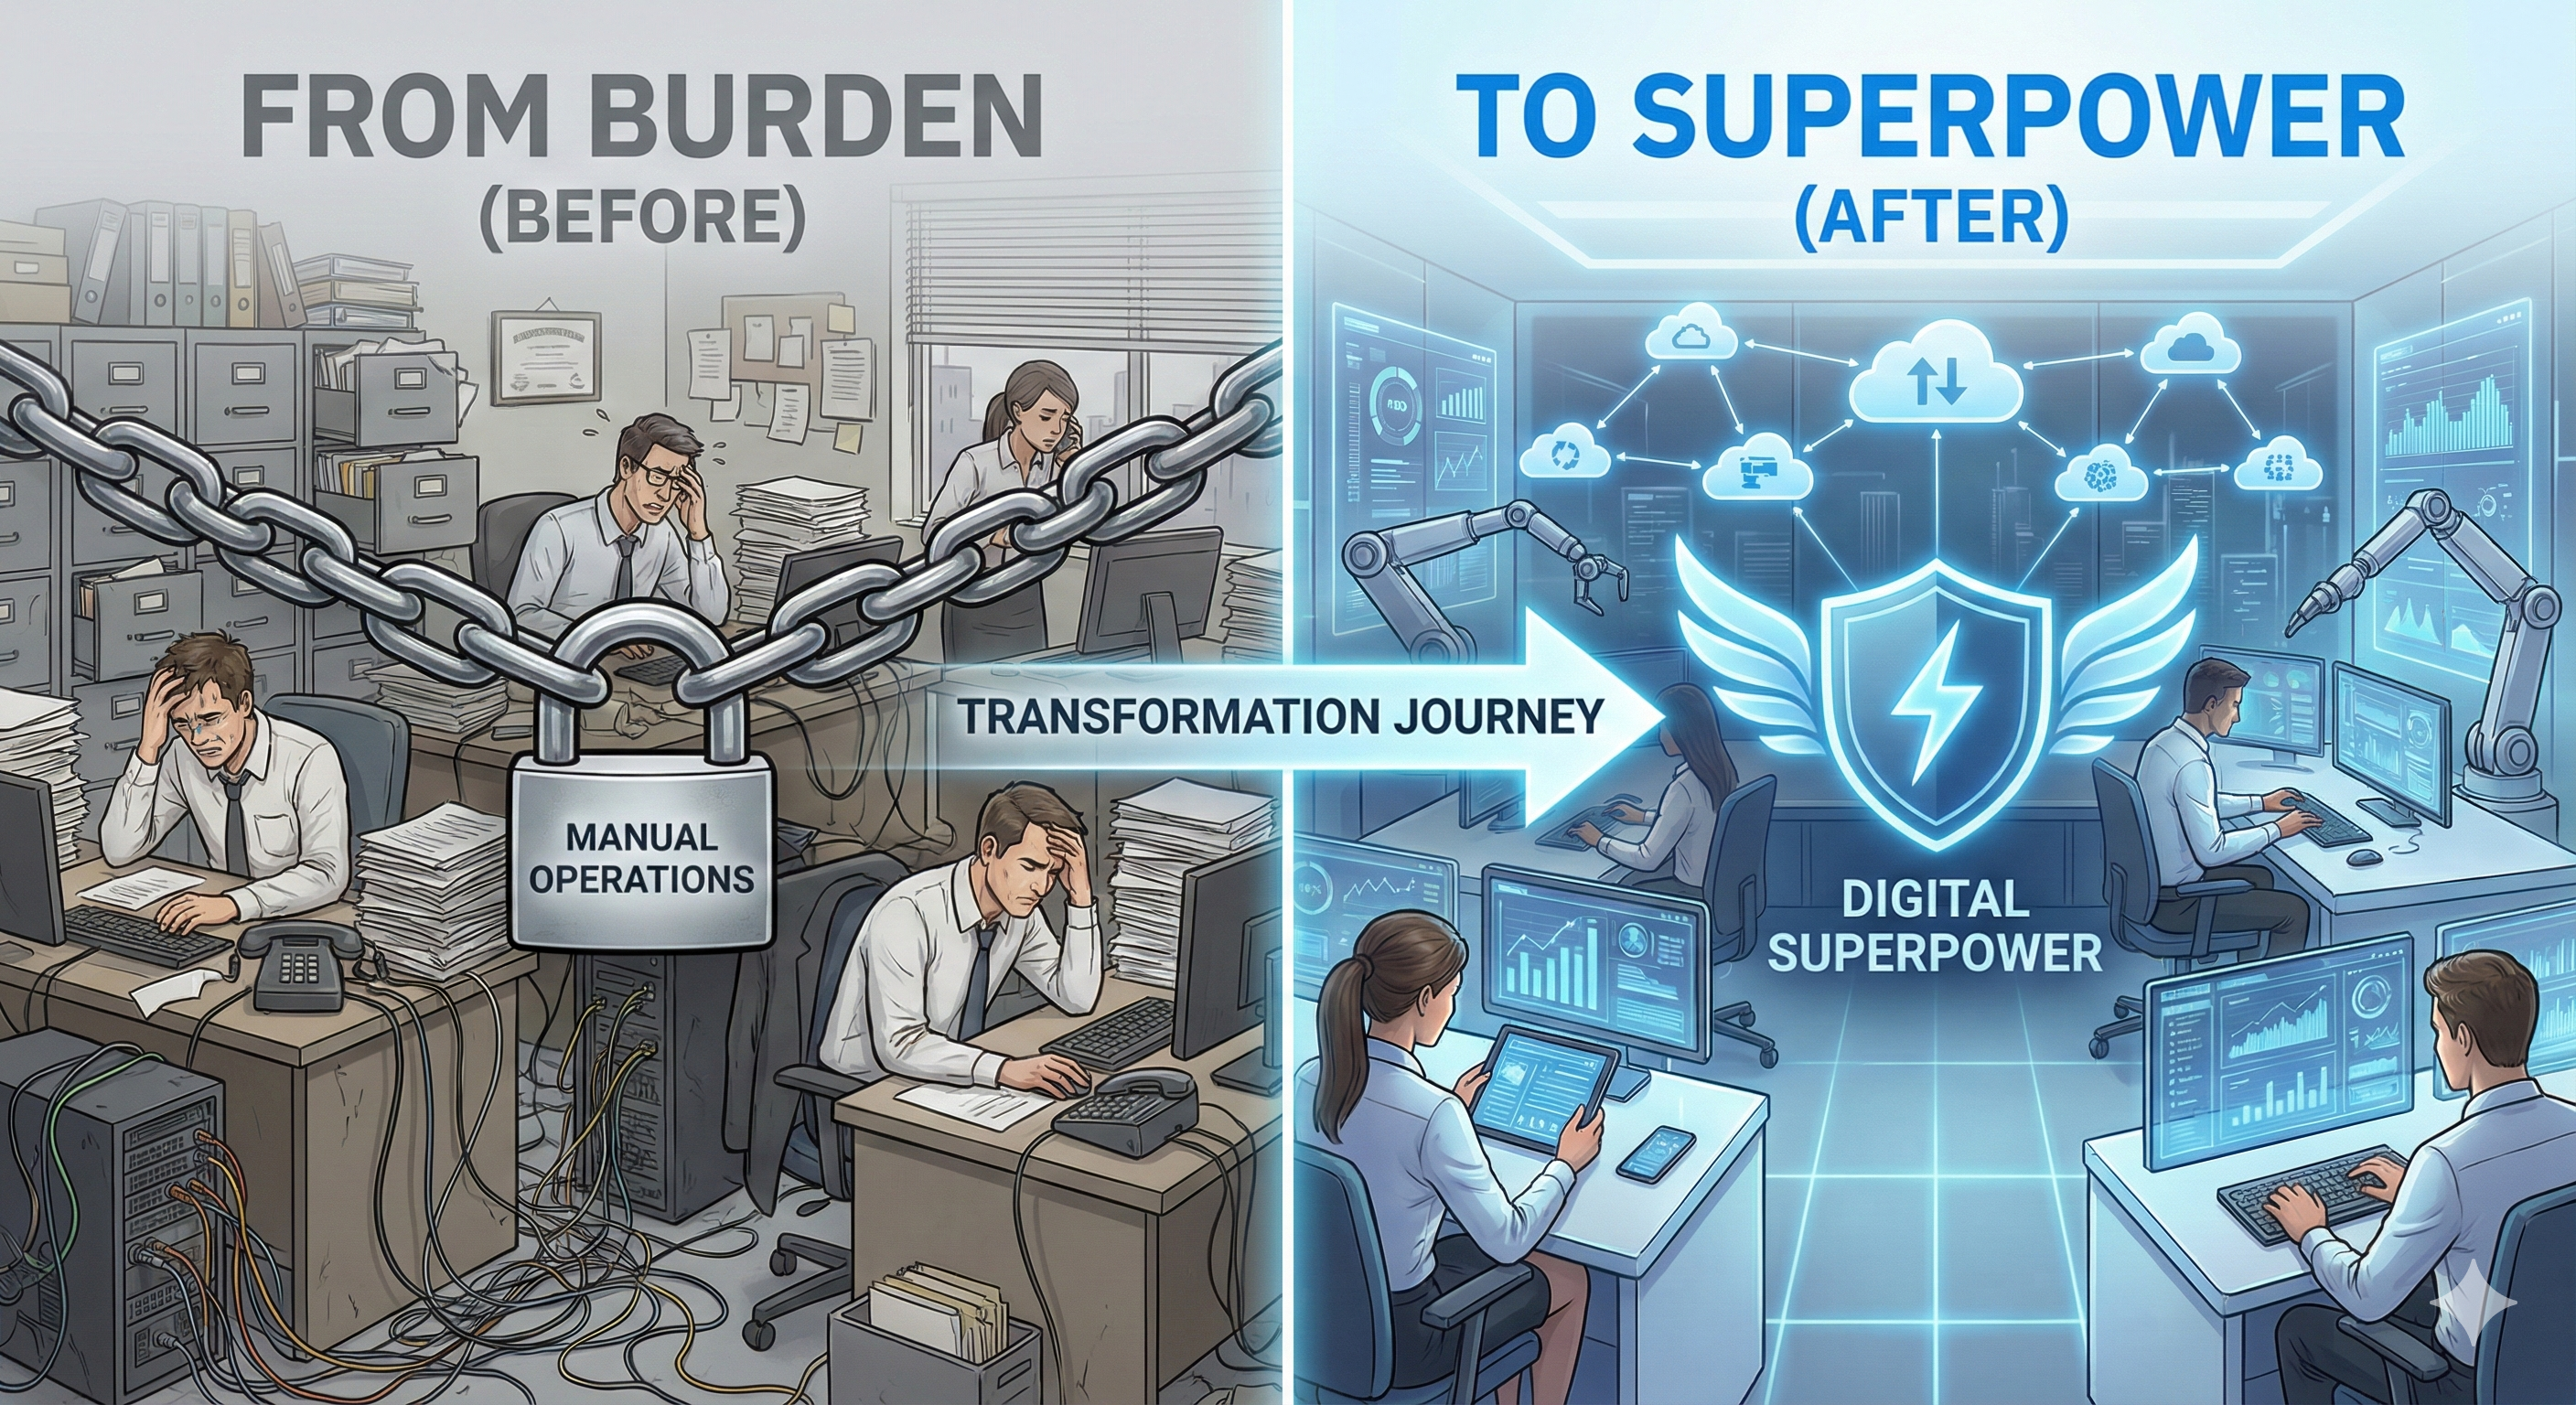
But here's what we hear most often at this point: "Show me the complete picture. What does the FULL journey look like from start to finish?"
Today we're sharing that complete picture through detailed transformation stories. These aren't case studies with sanitized metrics. These are journeys—with struggles, breakthroughs, setbacks, and ultimate success.
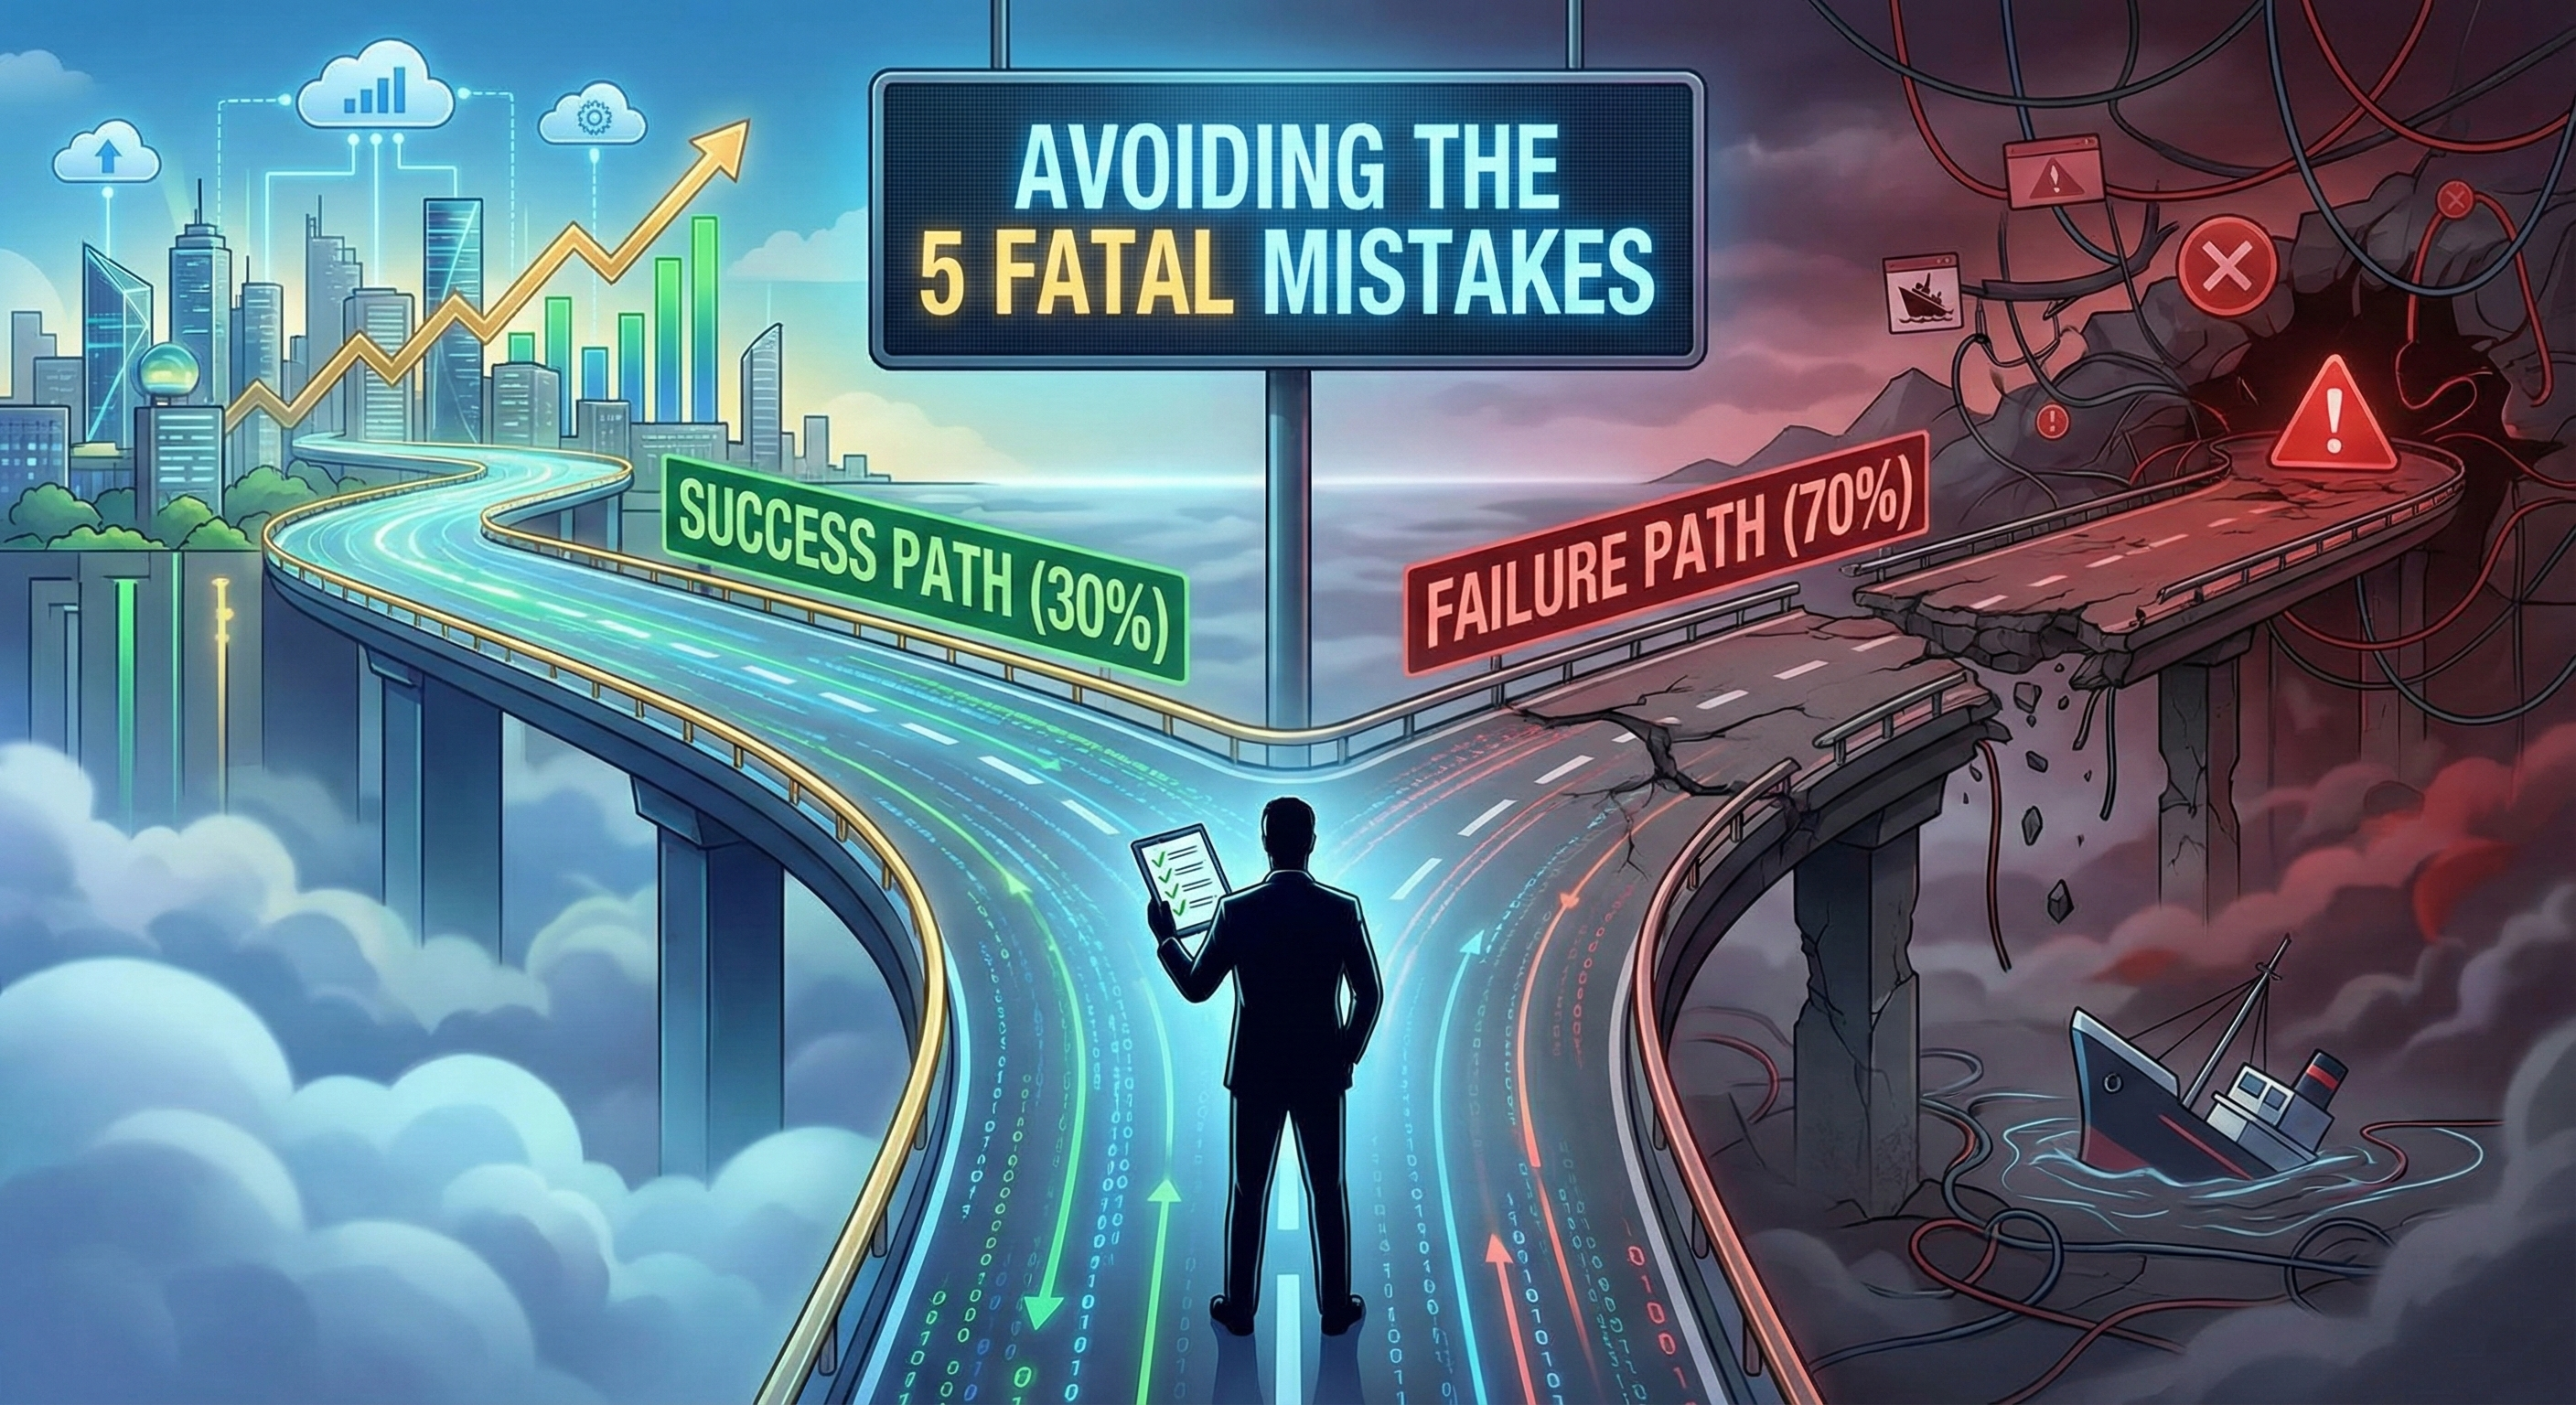
By the end of this article, you'll see what's possible and recognize yourself in these stories.
How to Read These Stories
Each story follows the same structure:
- The Breaking Point: What finally made them act
- The Journey: Month-by-month reality
- The Struggle: When they almost quit
- The Breakthrough: When everything clicked
- The Results: Where they are now
- The Lesson: What they learned
Look for similarities to your situation. Note the patterns. Focus on the journey, not just the outcome.
Story 1: The Regional Service Company
Industry: Field Service (HVAC, Plumbing, Electrical) Size: 25 employees (20 technicians, 5 office) Revenue: $3.5M annually
The Breaking Point
It was a Tuesday morning when everything came to a head. The office manager was on her third hour of phone calls, manually coordinating technicians. A technician called from a job site—wrong part, another wasted hour. A customer called asking where their technician was (he'd arrived 30 minutes ago—no notification sent).
The owner calculated that they'd turned away $50,000 in work that month because they couldn't handle more volume. Not because of lack of technicians, but because their dispatch process couldn't coordinate any more jobs.
"We can't grow this way," he realized. "We're hitting a ceiling that has nothing to do with market demand and everything to do with operations."
The Journey: Month by Month
Months 1-2: Excitement and Reality Implemented mobile tablets for technicians. Digital work orders replaced paper. Initial excitement: "This is going to change everything!"
Reality: Technicians slower entering data than writing. Complaints: "The old way was faster." Office manager overwhelmed learning the new scheduling system. Owner nervous about the investment.
Months 3-4: The Dip The hardest period. Running paper AND digital systems simultaneously. Everyone doing double work. Two technicians vocal about wanting to go back. Owner questioning the decision.
Metrics actually looked WORSE:
- Jobs per day: 3.5 → 3.2 (slower during learning)
- Admin time: 3 hours → 4 hours (managing two systems)
- Team satisfaction: Declining
Months 5-6: The Turn Week 17: First technician said, "I love this thing. I can see my whole day, customer history, everything." Others noticed his efficiency.
Week 20: Office manager: "I'm finally getting it. I can see where everyone is. This is actually easier."
Week 24: Turned corner. Everyone using tablets. Paper completely gone. First real efficiency gains visible.
Months 7-9: The Acceleration Week 30: Customer portal launched. Customers could track service in real-time. Immediate positive feedback.
Week 35: Automated billing integrated. Payment time dropped from weeks to days. Cash flow transformed.
Month 9: Owner checking dashboard on phone, seeing real-time profitability by job type. Making data-driven decisions for first time ever.
The Struggle: The Moment They Almost Quit
Month 4, Week 15. Two-hour team meeting. Technicians complained: productivity down, everything takes longer, old way was better.
Owner asked the implementation partner: "Should we go back?"
Partner: "This is Week 15. This is exactly when most companies quit. You're in the dip. Look at your adoption rate—75%. You're almost through. Quitting now means you've paid all the pain for none of the gain."
Owner decided to push through. Added two extra training sessions. Listened to specific complaints. Made adjustments.
That decision—to push through Week 15—made all the difference.
The Breakthrough
Month 7, Week 28. The tipping point arrived suddenly.
Tuesday morning: Five technicians completed their first jobs and were already on second jobs by 10 AM—unheard of before.
Customer called: "I just got a text that the technician is on the way with a photo of him and his truck. That's amazing!"
Office manager at 11 AM: "I haven't made a single manual coordination call yet today. The system is just... working."
Owner looking at dashboard: Four jobs completed before noon. Average margin 48%. Team performing 40% better than three months ago.
Everything clicked at once.
The Results: One Year Later
Operational Transformation:
- Jobs per technician: 3.5 → 5.2 per day (49% increase)
- Payment cycle: 2-3 weeks → 2 days
- Customer satisfaction: Dramatically improved, referrals up 35%
- Office admin time: 3 hours/day → 30 minutes/day
Financial Impact:
- Revenue: $3.5M → $4.6M (31% growth, same team size)
- Gross margin: 42% → 51% (better visibility, less waste)
- Customer retention: 68% → 89%
- Cash flow: Predictable and healthy for first time
Cultural Shift: Technician (the former skeptic): "I can't believe we used to do this on paper. My job is so much easier. I get to actually fix things instead of running around."
Office manager: "I used to spend all day as a human dispatcher. Now I build customer relationships and help grow the business."
Owner: "For the first time in 15 years, I know exactly how my business is performing. I sleep better. I make better decisions. We can actually plan for growth."
The Lesson
"The dip was harder than we expected. Week 15 almost broke us. But pushing through that week—not giving up when it felt hardest—that's what separated us from companies that fail. Now our competitors are trying to copy what we do, but they're two years behind."
Story 2: The Professional Services Firm
Industry: Management Consulting Size: 45 employees (30 consultants, 15 support staff) Revenue: $12M annually
The Breaking Point
Partner meeting, end of Q2. The finance director presented profitability analysis: 25% of projects were unprofitable, but they didn't know which ones until after completion.
Partners were spending 10+ hours weekly on administrative tasks instead of billable work. Billable utilization was 60% (target: 75%). Proposals took 2-3 days to create, often losing deals to faster competitors.
Managing Partner: "We're leaving enough money on the table annually to hire five more consultants. This isn't a revenue problem—it's an operations problem."
The Journey
Months 1-3: Pilot Approach Smart decision: Started with one practice area (six consultants) as a pilot.
Implemented time tracking and project management for that group. Consultants grumbled about time tracking: "This is annoying. I'm a consultant, not a timekeeper."
Partner leading pilot: "Try it for 8 weeks. If it doesn't provide value, we'll stop."
Week 8: Pilot group saw their first project profitability report in real-time. Jaw-dropping moment: Project they thought was profitable was actually losing money. Could course-correct immediately.
Months 4-6: Scaling Challenges Other practice areas wanted access after seeing pilot results. Rolled out to all six practices.
Adoption varied wildly: Practice A at 90%, Practice D at 40%. Had to address resistance individually. Some partners skeptical: "We've operated on gut feel for 20 years. Why change now?"
Turning point: Showed partners the data. Projects they thought were winners were losers. Projects they considered marginal were actually highly profitable. Data changed minds.
Months 7-9: Integration Magic Integrated proposal generation with CRM. Game changer.
What used to take 2-3 days (assembling client background, finding relevant case studies, creating custom presentations) now took 4 hours. Could respond same-day to RFPs.
Win rate improved immediately: 35% → 48%. Speed mattered in competitive situations.
The Struggle
Month 5. Practice D partners resisting. Utilization wasn't improving. One senior partner vocal: "I don't need software to tell me how to run my projects."
Managing Partner considered making it optional for senior partners. Implementation partner warned: "If leadership doesn't use it, no one will. You'll fail."
Difficult conversation with resistant partner. Compromise: "Use it for just one project. If it doesn't show value, I'll listen to your concerns."
Three weeks later, that partner became the biggest advocate. Discovered his "most profitable" client was actually break-even when actual costs calculated.
The Breakthrough
Month 8. Everything crystallized during a business development pitch.
Prospect: "When can you get us a proposal?"
Before: "We'll have something to you by end of next week." Now: "I can send you a customized proposal this afternoon."
Prospect visibly impressed. Won the deal.
Same week: Team hit 73% billable utilization (up from 60%). Partner admin time dropped from 10 hours to 2 hours weekly. Profitability visibility helped identify and exit unprofitable client relationships, freeing capacity for better work.
The Results
After 12 Months:
- Billable utilization: 60% → 73%
- Proposal creation: 2-3 days → 4 hours
- Project profitability visibility: 0% → 100%
- Proposal win rate: 35% → 48%
- Revenue: $12M → $14.8M (23% growth, same headcount)
- Profitable projects: 75% → 92%
- Partner time on admin: 10 hours/week → 2 hours/week
Strategic Changes: Data revealed which types of projects were profitable vs. which weren't. Made strategic decision to focus on three highly profitable service lines, exit two unprofitable ones.
Result: Higher revenue, better margins, more satisfied consultants (working on interesting projects), and happier clients (better service delivery).
The Lesson
"We thought we knew our business. The data showed we didn't. We were making decisions on gut feel that cost us millions. The resistance from senior partners was real—ego, fear of looking incompetent, comfort with the old way. But once they saw the data, everything changed. You can't argue with profitability numbers."
Story 3: The Manufacturing Company
Industry: Custom Metal Fabrication Size: 85 employees Revenue: $18M annually
The Breaking Point
The phone call that changed everything. Their largest customer (representing $3M annually): "We're finding another supplier. You're unreliable. On-time delivery is 65%. We need 95%+. Get your operations under control or we're done."
Losing that customer would mean layoffs, possibly closing one facility. The operations director pulled data: on-time delivery was actually 65%. Inventory accuracy: 70%. Rework rate: 12%. Quality inconsistent.
CEO: "We have six months to fix this or we lose them. This isn't a customer problem—it's an us problem."
The Journey
Months 1-4: Foundation Hell Implemented barcode scanning for inventory. Sounds simple. Was chaos.
Week 1-2: Scanner batteries dying mid-shift. Week 3-4: Scans not syncing properly. Week 5: Workers frustrated, taking longer to scan than manual logging. Week 6-8: Data cleaning revealed inventory was even worse than thought—dozens of parts shown in system weren't physically there.
CEO considered quitting. Consultant: "This is the mess you've been living with—you just couldn't see it before. Now you can see it, you can fix it."
Months 5-8: Slow Progress Inventory accuracy improving: 70% → 85% → 92%.
Implemented digital job routing. Shop floor workers initially resistant. Tablets on machines felt foreign. "We've done this on paper for 30 years."
Week 20: First worker said it out loud: "I can actually see what I'm supposed to do, in order, with pictures. This is better."
Months 9-12: Integration and Breakthrough Month 9: Real-time production tracking live. Management could see exactly where each job was, any time.
Month 10: Quality checkpoints built into routing. Can't move to next step without completing quality check. Rework rate dropping.
Month 11: Customer portal launched. Customers could log in and see their order status in real-time. Phone calls asking "where's my order?" dropped 60%.
Month 12: The moment that mattered. The CEO called the customer who'd threatened to leave.
"Log into this portal. This is your order. See the real-time status? Photos at each stage? Estimated completion? This is your experience now. On-time delivery is now 94%."
Customer: "This is exactly what we needed. We're not just staying—we're increasing our order volume."
The Results
Operational Excellence:
- On-time delivery: 65% → 94%
- Inventory accuracy: 70% → 98%
- Rework/scrap: 12% → 4%
- Customer inquiry response: 24 hours → instant (portal)
Financial Impact:
- Revenue: $18M → $23M (kept major customer + grew)
- Gross margin: 28% → 35%
- Overtime: Down 60% (better scheduling)
- Material waste: Reduced significantly
Competitive Advantage: The customer portal became a sales tool. Prospects: "Nobody else in the industry offers this level of transparency." Won three major contracts specifically because of operational capabilities.
The Lesson
"We almost quit after the first month. The scanning system wasn't working. Workers were frustrated. Everything felt harder. But the consultant was right—we were just seeing the mess that had always been there. Once we could see it, we could fix it. Now customers choose us because of our operations, not despite them."
Common Patterns Across All Stories
Looking at these three transformations:
Pattern #1: The Dip Is Real and Predictable
- All three hit a crisis point between Weeks 12-20
- All three had vocal resisters
- All three questioned whether to continue
- All three who pushed through succeeded
Pattern #2: The Breaking Point Precedes Action
- Financial pain became unbearable
- Customer pressure forced the issue
- Growth ceiling became visible
- The status quo became more painful than change
Pattern #3: Quick Wins Build Credibility
- Early skeptics became eventual champions
- Pilots prove value before full commitment
- Visible improvements overcome resistance
- Data changes minds better than arguments
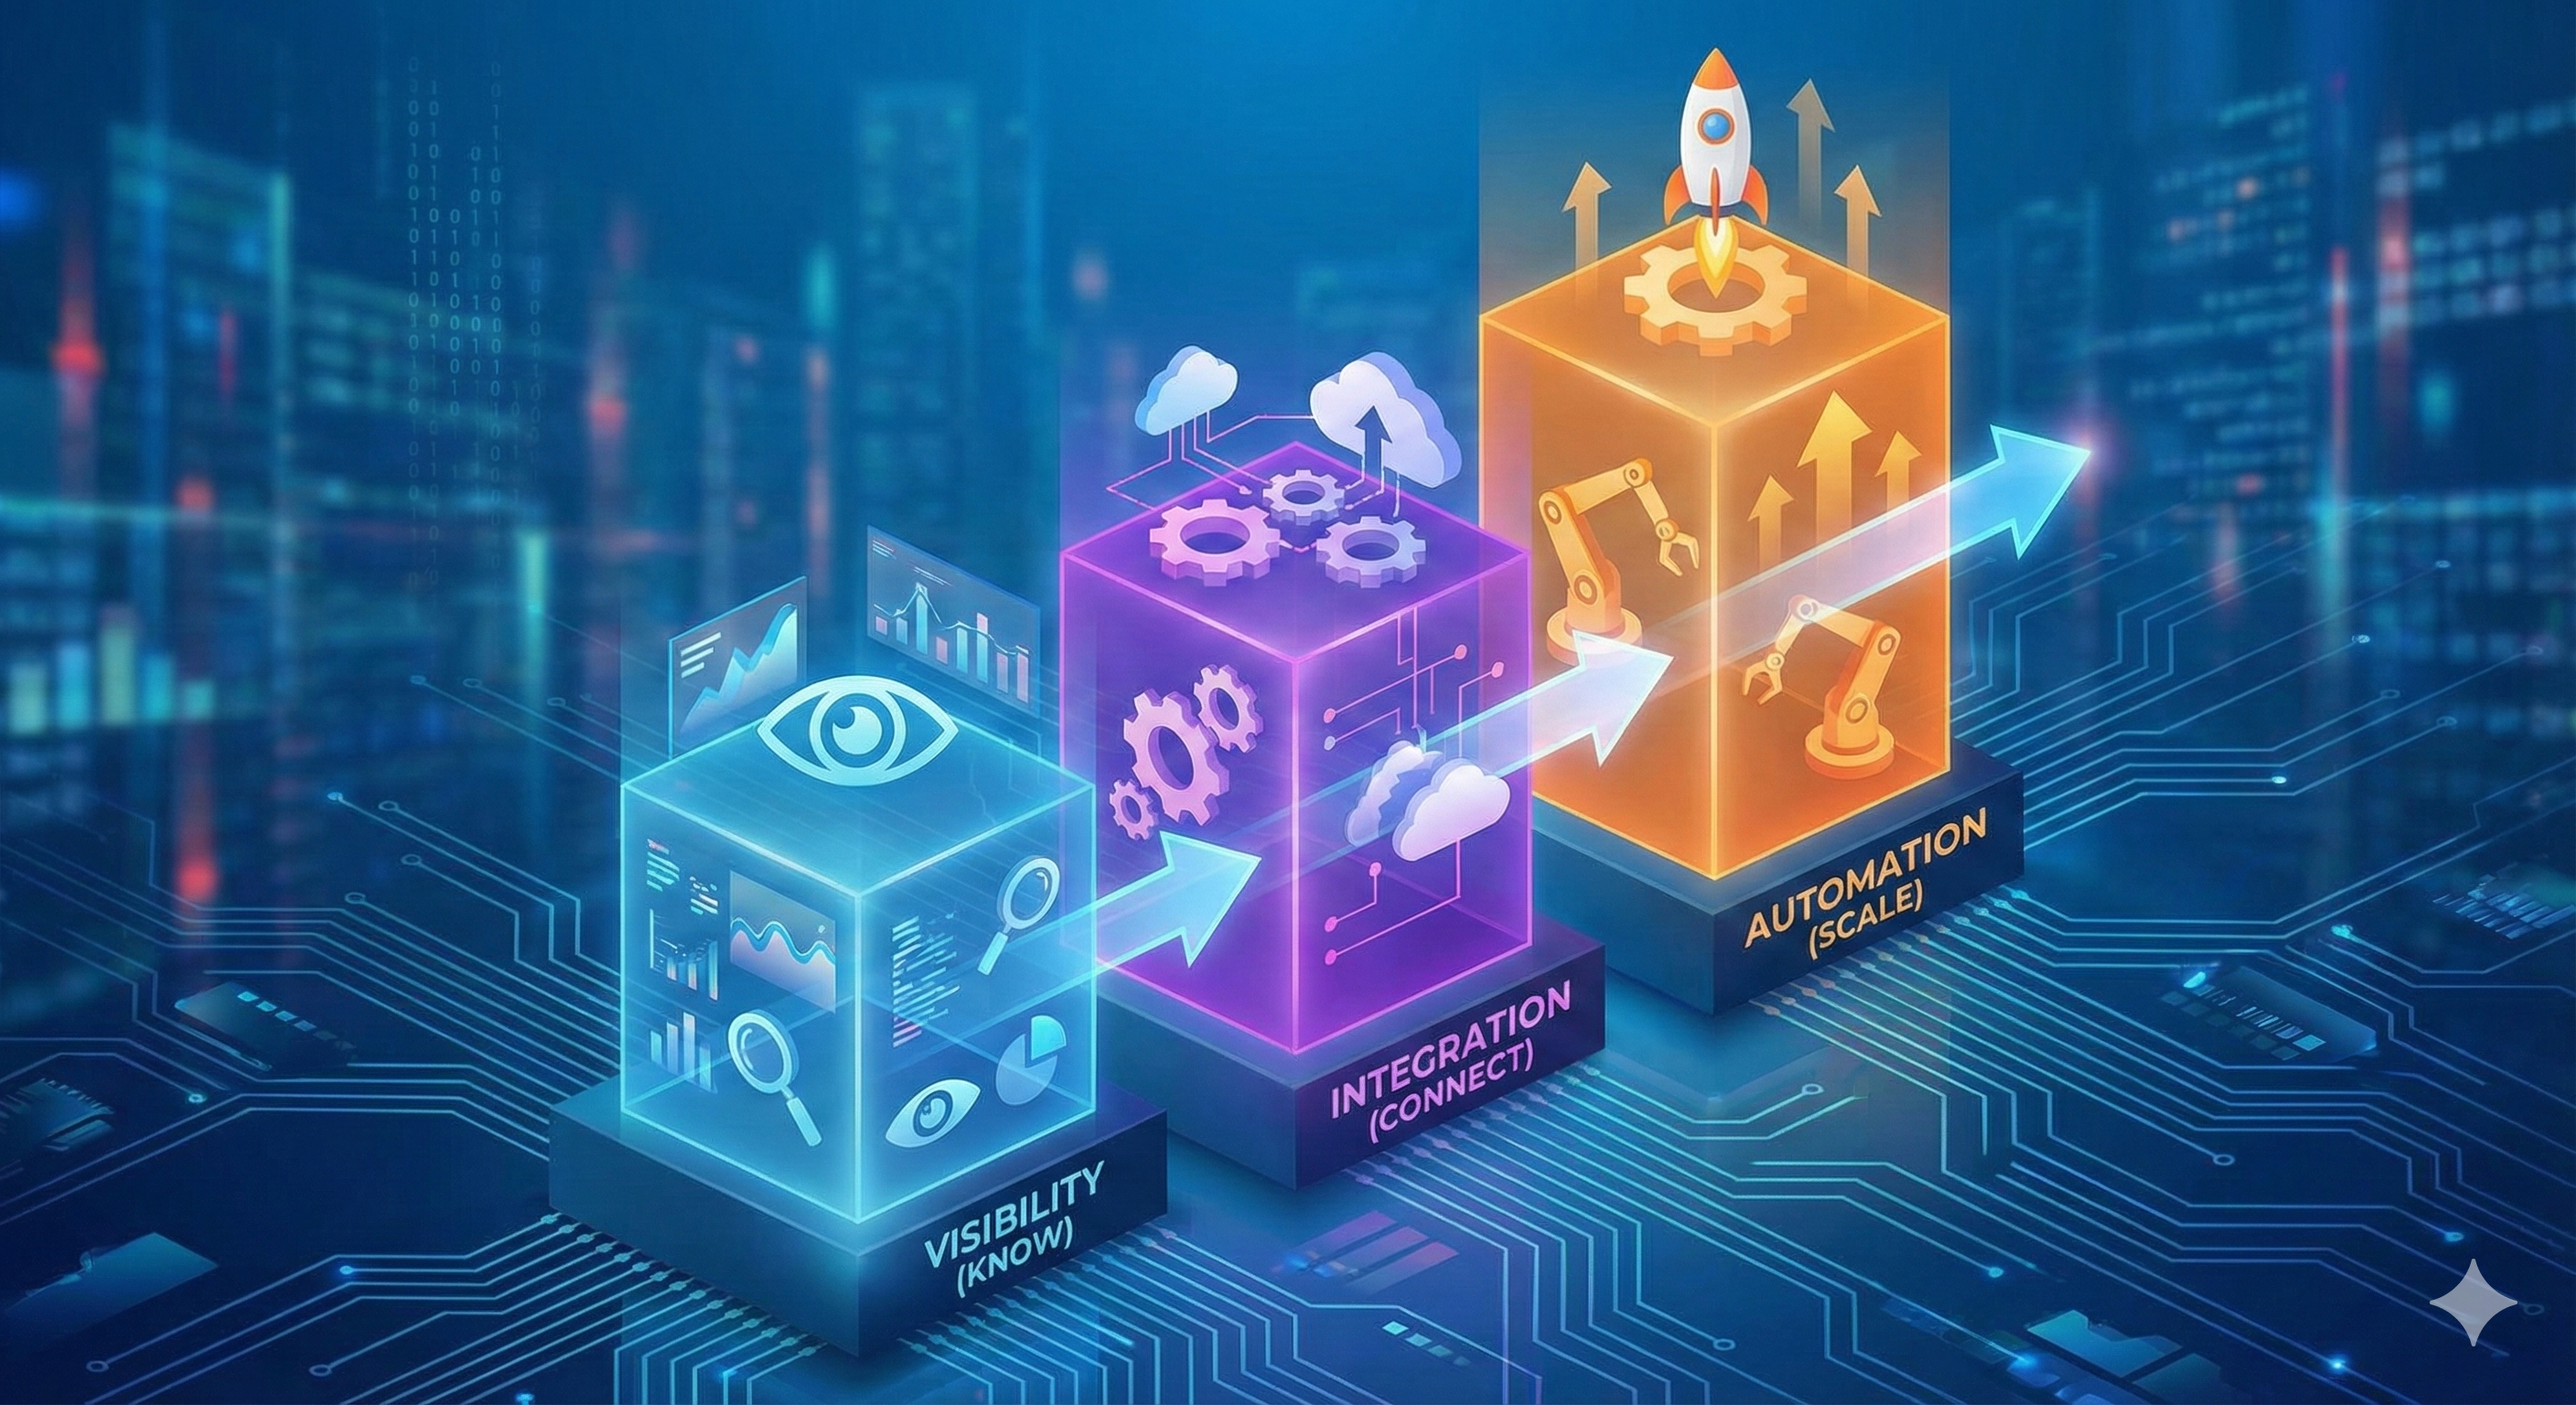
Pattern #4: Integration Creates Compound Value
- Individual tools help
- Connected tools multiply value
- Real magic happens when everything works together
- 1 + 1 + 1 = 10, not 3
Pattern #5: Users Can't Imagine Going Back
- Universal sentiment by Month 9-12
- Former resisters become biggest advocates
- "How did we ever...?" conversations
- New baseline established
What These Stories Mean for You
If you're considering transformation: These journeys started with pain, proceeded through doubt, and ended in breakthrough. The pattern is predictable.
If you're mid-transformation: You're likely in one of these phases. If you're in the dip (Months 3-6), you're exactly where these companies were before breakthrough.
If you're experiencing resistance: Every single one of these stories had loud resisters who became champions. Resistance is normal, not failure.
If you're questioning ROI: All three saw ROI within 12-18 months. All three wish they'd started sooner. All three say the transformation paid for itself many times over.
What's Coming Next
Next week (Article 11): "Future-Proofing Your Digital Success"—How to protect and amplify your investment through maintenance, continuous improvement, and staying ahead of the curve.
In two weeks (Article 12): "Your Next Chapter"—We'll wrap up the series with advanced strategies for digital leaders and where to go from here.
These stories show what's possible. They started where you are. They struggled like you're struggling. They broke through.
The question isn't whether transformation works. The question is: When will you start your story?
Series Progress:
- ✅ Articles 1-9: Complete journey framework
- ✅ Article 10: Real transformation stories (today)
- Coming Next: Sustaining and scaling success
Ready to write your transformation story? Contact SunNet Solutions to discuss your journey and how we can help you achieve breakthrough.
This is article 10 of our 6-month Digital Transformation Journey.