Article 3 of our Digital Transformation Journey. We've identified problems (Article 1) and calculated costs (Article 2). Today: What does the solution actually look like?
If you've been following this series, you now understand the warning signs of digital chaos and have a sense of what they might be costing you.
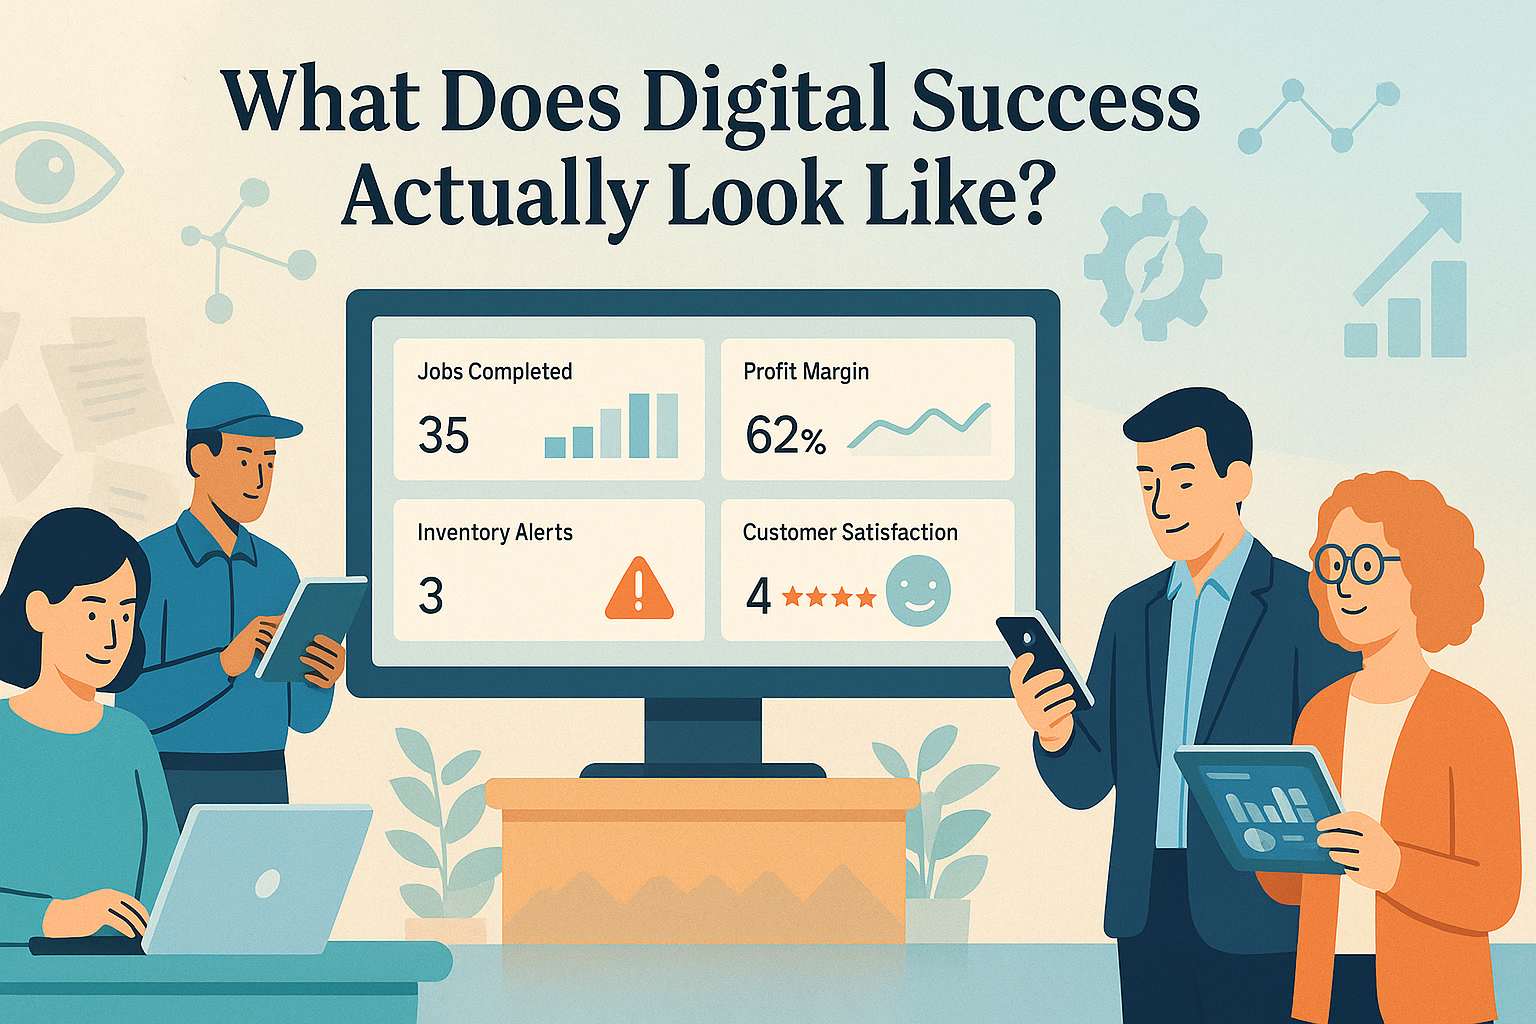
But here's what we hear most often at this point: "Okay, I understand the problem and the cost. But what does the solution actually look like? What does 'digital success' mean in practical, everyday terms?"
Fair question. "Digital transformation" sounds abstract and intimidating. It conjures images of massive IT projects, complex integrations, and months of disruption.
Let me cut through that and show you what digital success actually looks like in real businesses—what changes in daily operations, what becomes possible, and most importantly, what it feels like when you get there.
The Four Pillars of Digital Success
Before we look at specific examples, here's a framework. Every successful transformation we've seen—whether it's a 20-person service company or a 200-person manufacturer—achieves success across four pillars:
Pillar 1: Visibility Real-time access to business metrics. A single source of truth for data. Clarity on operations, finances, and customers. The ability to spot trends and anomalies before they become problems.
Pillar 2: Integration Systems talking to each other automatically. No double-entry or manual data transfer. Information flowing where it's needed, when it's needed. A unified view of customers, projects, and operations.
Pillar 3: Automation Repetitive tasks handled by technology. Workflows triggering automatically. Proactive alerts and notifications. The ability to scale without multiplying headcount.
Pillar 4: Scalability Systems that grow with your business. Technology that enables growth rather than limiting it. The confidence to say "yes" to opportunities because you know your systems can handle them.
Here's the important part: You don't need all four pillars perfect to see dramatic improvement. Progress on each pillar creates value. But when all four work together? That's when transformation happens.
Before and After: A Service Business Transformation
Let's walk through what transformation looks like for a service business. This example is based on common patterns we see across field service companies.
Before: The Daily Reality
Monday Morning, 7:30 AM
The office manager arrives to find a dozen voicemails from customers. She spends the next hour returning calls and manually scheduling appointments in a paper planner. By 9 AM, she's calling technicians one by one to dispatch them to jobs.
10:00 AM - In the Field
A technician arrives at a customer's home. The work order says "AC not cooling." That's all the information provided. No service history. No equipment details. He spends 20 minutes diagnosing what he would have known instantly with proper information.
He realizes he needs a specific part. Calls the office. "Do we have this part in stock?" The office manager puts him on hold, walks to the parts room to check. "No, you'll need to pick one up." There goes another hour and the profit margin on this job.
Meanwhile, the customer calls the office asking when the technician will arrive. He's already there, but no one sent a notification.
3:00 PM - Back at the Office
The technician has completed three jobs. He's exhausted from running around and frustrated by the inefficiency. He hands over three paper work orders to the office. Those won't be entered into the accounting system for billing until next week. Cash flow? Completely unpredictable.
The Owner's Perspective
The owner has no idea if the business is profitable until the accountant sends financials 30 days after month-end. Strategic decisions are made on gut feeling because getting actual data takes too long.
After: What Changed
Let's look at the same business 12 months after implementing an integrated field service management system.
Monday Morning, 7:30 AM
The office manager logs into her dashboard and can see:
- All scheduled appointments for the week
- Technician locations in real-time via GPS
- Available appointment slots
- Parts inventory levels
- Yesterday's revenue and profit margins
A customer request came in via the online portal at 11 PM last night. The system has already:
- Checked service history for this customer
- Identified the equipment installed at this address
- Suggested available time slots based on technician proximity and skills
- Sent appointment options to the customer's phone
The customer confirmed a slot. The appointment automatically appeared on the technician's schedule.
10:00 AM - In the Field
The technician arrives at the customer's home. His tablet shows:
- Complete service history for this property
- Equipment specifications and model numbers
- Common issues with this equipment type
- Photos from the last service visit
- Parts likely needed (the system predicted this based on the issue)
He diagnoses the problem in 5 minutes instead of 20. Checks inventory on his tablet—the part he needs is in his truck (the system suggested loading it this morning based on his schedule). He completes the repair in 45 minutes.
When he marks the job complete:
- The customer receives an automatic text: "Service complete. Here's what we did..."
- Photos of the repair are attached to the job record
- The invoice is automatically generated and emailed
- A payment link is sent to the customer's phone
- The accounting system is updated automatically
- The next maintenance reminder is scheduled
The customer pays online within 2 hours. Cash flow just accelerated by weeks.
The Owner's Perspective
The owner is checking his phone at lunch and sees the real-time dashboard:
- 4 jobs completed this morning
- Average profitability: 48% margin
- On track for best month ever
- One technician is performing exceptionally well (5.2 jobs per day vs. team average of 4.8)
- Low inventory alert on two items—automatic reorder has been triggered
The Results
Operational Improvements:
- Jobs per technician per day: 3.5 → 5.2 (49% increase)
- Time from job completion to payment: 2-3 weeks → 2 days
- Customer satisfaction scores: Dramatically improved
- Office admin time on dispatch: 3 hours/day → 30 minutes/day
What Success Feels Like:
The technician: "I can't believe we used to do this on paper. My job is so much easier now. I spend my time actually fixing things instead of running around looking for information."
The office manager: "I used to spend my entire day on the phone playing coordinator. Now I can focus on customer relationships and helping grow the business."
The owner: "For the first time in 15 years, I actually know how my business is performing in real-time. And I sleep better knowing we're delivering better service than ever."
What Success Looks Like Across Different Business Types
Let's look at what transformation means for different types of businesses:
Professional Services (Consulting, Legal, Accounting)
Before:
- No visibility into project profitability until it's too late
- Proposals take 2-3 days to create
- Time tracking is inconsistent
- Partners spending 10+ hours weekly on administrative tasks
After:
- Real-time project profitability dashboards
- Proposals generated in hours instead of days
- Automatic time tracking with mobile apps
- Partners focused on billable work, not administration
- Client portals providing transparency and self-service
What Becomes Possible:
- Can identify and fix unprofitable projects before they lose money
- Win more proposals due to faster response times
- Make data-driven decisions about which types of projects to pursue
- Scale revenue without proportionally scaling administrative overhead
Manufacturing and Distribution
Before:
- Inventory accuracy around 70% (constant discrepancies)
- On-time delivery struggling
- Production scheduling is chaos
- No real-time visibility into job status
- Quality control is inconsistent
After:
- Inventory accuracy above 95% with real-time tracking
- On-time delivery dramatically improved
- Optimized production scheduling
- Real-time job status for everyone who needs it
- Automated quality control checkpoints
What Becomes Possible:
- Can promise delivery dates with confidence
- Reduce working capital tied up in excess inventory
- Take on more complex jobs because operations can handle it
- Customer portals showing real-time order status
- Data-driven decisions about capacity and pricing
Retail and E-commerce
Before:
- Inventory sync between online and physical locations failing
- Customer service buried in "where's my order?" inquiries
- Marketing attribution impossible (don't know which ads work)
- Manual data entry between multiple systems
After:
- Real-time inventory across all channels
- Customer service focused on complex issues (AI handles routine)
- Clear marketing attribution and ROI tracking
- Unified view of customer across all touchpoints
What Becomes Possible:
- Run promotions without inventory chaos
- Scale customer service without proportional headcount growth
- Make data-driven marketing decisions
- Deliver Amazon-level customer experience as a smaller business
The Common Thread: What All Success Stories Share
Looking at successful transformations across different industries, several patterns emerge:
All Four Pillars Are Present:
- Visibility: Dashboards showing what matters
- Integration: Systems talking automatically
- Automation: Workflows happening without human intervention
- Scalability: Ready for growth
The Team's Relationship with Technology Changes:
- From "fighting the system" to "the system helps me"
- From reactive firefighting to proactive problem-solving
- From administrative burden to strategic focus
- From "how things have always been" to continuous improvement mindset
Decision-Making Transforms:
- From gut-feel to data-informed
- From monthly retrospectives to real-time adjustments
- From wondering what happened to knowing why and what to do
- From slow deliberation to confident, rapid decisions
Customer Experience Improves:
- From "we'll get back to you" to instant information
- From fragmented interactions to seamless experience
- From hoping they're satisfied to knowing they are
- From reactive service to proactive communication
Defining Your Own Success Vision
Now it's your turn. Instead of looking at other companies, let's envision what success looks like for YOUR business.
The Perfect Monday Morning Exercise
Close your eyes and imagine your ideal workday after transformation:
You arrive at work and open your laptop. What do you see?
- One dashboard showing how your business performed yesterday
- What needs your attention today
- Where you're trending this month
- Alerts for anything important
You need to answer a business question. What happens?
- You can answer any question in under 2 minutes
- The data is current (not from last month)
- You trust the accuracy
- You can drill down for details if needed
Your team is working. What are they doing?
- Focused on meaningful work, not fighting systems
- No one is manually copying data between systems
- No one is hunting for information
- Problems surface automatically before becoming crises
A customer interacts with you. What's their experience?
- They receive proactive communication without anyone manually sending it
- They can get answers instantly through self-service
- They feel like you're organized and professional
- They're impressed by your responsiveness
You're making a strategic decision. How does it feel?
- You have confidence because you have the data
- You can see the potential impact
- You can act quickly while competitors are still gathering information
- You say "yes" to opportunities because you know your systems can handle them
What would that be worth to you?
Creating Your Success Metrics
Don't measure success against some universal standard. Define it for YOUR business:
Pick 3-5 metrics that matter most to you:
Time Savings Metrics:
- Hours saved per week on manual tasks
- Decision-making speed improvement
- Report generation time reduction
Revenue Impact Metrics:
- Sales cycle length reduction
- Customer retention improvement
- Capacity increase without headcount growth
Customer Satisfaction Metrics:
- Response time improvement
- Service quality scores
- Customer effort reduction
Employee Satisfaction Metrics:
- Turnover reduction
- Time spent on meaningful vs. administrative work
- System satisfaction scores
These become your North Star—the measures that tell you whether transformation is working.
What Success Doesn't Look Like
It's equally important to know what success is NOT:
Success is NOT:
- Having the fanciest, most expensive systems
- Using every feature of every platform
- Automation for automation's sake
- Technology that impresses other tech people but confuses your team
- Perfection before launch
- "Done" (it's ongoing evolution)
Success IS:
- Systems that fade into the background because they just work
- Technology that makes your team's jobs easier
- Automation that eliminates frustration
- Solutions your customers notice (in a good way)
- Progress over perfection
- Continuous improvement culture
From Vision to Reality
Success doesn't happen overnight. Transformation typically takes 6-18 months depending on scope and complexity. The journey is iterative. Early wins matter.
But first, you need the right mindset—which is exactly what we'll cover in next week's article.
What's Coming Next
Next week (Article 4): "From Reactive to Proactive"—the fundamental mindset shift that separates companies that thrive from those that merely survive. We'll explore how to use technology as a growth engine instead of constantly firefighting.
In two weeks (Article 5): "The 3-Pillar Framework"—the specific, step-by-step approach every successful transformation follows. You'll learn exactly where to start and how to sequence your transformation.
Series Progress:
- ✅ Article 1: Identified the five warning signs
- ✅ Article 2: Calculated the real costs
- ✅ Article 3: Envisioned what success looks like (today)
- Coming Next: The proactive mindset shift
Ready to discuss what success could look like for your business? Contact SunNet Solutions for a complimentary consultation. We'll help you envision your ideal state and create a roadmap to get there.
This is part 3 of our 6-month Digital Transformation Journey. Each article builds on the previous ones, creating a complete roadmap from chaos to sustained success.